| University | Nanyang Technological University (NTU) |
| Subject | ST2195 Programming for data science |
ST2195: Programming for data science, NTU, Singapore: In this part, you are asked to work with the Markov Chain Monte Carlo algorithm
Part 1
In this part, you are asked to work with the Markov Chain Monte Carlo algorithm, in particular the Metropolis-Hastings algorithm. The aim is to simulate random numbers for the distribution with probability density function given below
![]()
where x takes values in the real line and |x| denotes the absolute value of x. More specifically, you are asked to generate x0, x1, . . . , xN values and store them using the following version of the Metropolis-Hastings algorithm (also known as random walk Metropolis) that consists of the steps below:
Hire a Professional Essay & Assignment Writer for completing your Academic Assessments
Random walk Metropolis
Step 1 Set up an initial value x0 as well as a positive integer N and a positive real number s.
Step 2 Repeat the following procedure for i = 1, . . . , N:
• Simulate a random number x∗ from the Normal distribution with mean xi−1 andstandard deviation s.
• Compute the ratio
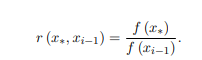
• Generate a random number u from the uniform distribution between 0 and 1.
• If u < r (x∗, xi−1), set xi = x∗, else set xi = xi−1.
(a) Apply the random walk Metropolis algorithm using N = 10000 and s = 1. Use the generated samples (x1, . . . xN ) to construct a histogram and a kernel density plot in the same figure. Note that these provide estimates of f(x).
Overlay a graph of f(x) on this figure to visualise the quality of these estimates. Also, report the sample mean and standard deviation of the generated samples (Note: these are also known as the Monte Carlo estimates of the mean and standard deviation respectively).
Practical tip: To avoid numerical errors, it is better to use the equivalent criterion log u < log r (x∗, xi−1) = log f (x∗) − log f (xi−1) instead of u < r (x∗, xi−1).
(b) The operations in part 1(a) are based on the assumption that the algorithm has converged. One of the most widely used convergence diagnostics is the so-called Rb value. In order to obtain a valued of this diagnostic, you need to apply the procedure below:
• Generate more than one sequence of x0, . . . , xN , potentially using different initial values x0. Denote each of these sequences, also known as chains, by
![]()
• Define and compute Mj as the sample mean of chain j as
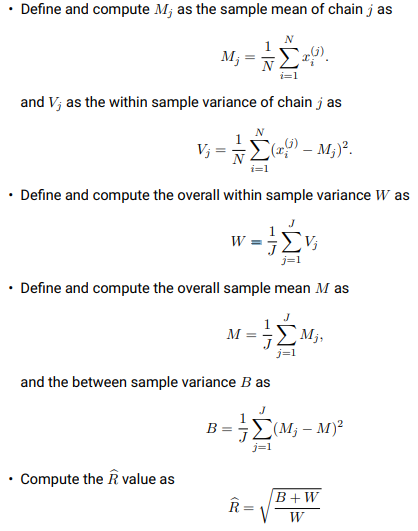
In general, values of Rb close to 1 indicate convergence, and it is usually desired for Rb to be lower than 1.05. Calculate the Rb for the random walk Metropolis algorithm with N = 2000, s = 0.001 and J = 4. Keeping N and J fixed, provide a plot of the values of Rb over a grid of s values in the interval between 0.001 and 1.
Buy Custom Answer of This Assessment & Raise Your Grades
Part 2
The 2009 ASA Statistical Computing and Graphics Data Expo consisted of flight arrival and departure details for all commercial flights on major carriers within the USA from October 1987 to April 2008. This is a large dataset; there are nearly 120 million records in total, and it takes up 1.6 gigabytes of space when compressed and 12 gigabytes when uncompressed. The complete dataset, along with supplementary information and variable descriptions, can be downloaded from the Harvard Dataverse at https://doi.org/10.7910/DVN/HG7NV7
Choose any subset of ten consecutive years and any of the supplementary information provided by the Harvard Dataverse to answer the following questions using the principles and tools you have learned in this course:
(a) What are the best times and days of the week to minimise delays each year?
(b) Evaluate whether older planes suffer more delays on a year-to-year basis.
(c) For each year, fit a logistic regression model for the probability of diverted US flights using as many features as possible from attributes of the departure date, the scheduled departure and arrival times, the coordinates and distance between departure and planned arrival airports, and the carrier. Visualize the coefficients across years.
Hire a Professional Essay & Assignment Writer for completing your Academic Assessments
"Excel in ST2195 Programming for Data Science Assignment with our dedicated support! We proudly present ourselves as your reliable source for assignment help in Singapore, providing specialized assistance. Singapore students, enhance your academic experience by paying for our expert services. Additionally, leverage our expertise in offering top-notch dissertation writing services in Singapore. Let us be your trusted partner in achieving success in your programming for data science coursework."
Tags:-

- Imagine that you are currently working for a precision medicine startup: Machine Learning Paper Review in Precision Medicine, Written Assignment 1, NUS, Singapore
- Go Business offers PSG solutions for enterprises in Singapore: Collective Intelligence and Entrepreneurship, Assignment 1, JCU, Singapore
- Design an ontology based on- Accidents can be categorised as chemical, electrical, fire, kinetic or liquid: Collective Intelligence and Entrepreneurship, Assignment 1, JCU, Singapore
- Project Control Monitoring, Assignment, HU, Singapore: Deliberate Project MONITORING AND CONTROL or PMC Identification
- DSM500: Final Project Report, Coursework 2, UOL, Singapore
- DSM080: Financial Markets, Assignment, UOL, Singapore: A grapefruit juice futures contract is for 15,000 pounds of frozen grapefruit juice
- DSM080: Financial Markets, Assignment, UOL, Singapore: The share price of a certain stock today is $42.50, and five-month European style call options with a strike price of $45 currently sell for $4.25.
- DSM080: Financial Markets, Assignment, UOL, Singapore: A trader who is working in the gold markets is able to borrow money at the interest rate of 7% per annum
- DSM080 Financial Markets, Assignment, UOL, Singapore: A dollar-based American corporation has decided that it will have to pay 6 million UK pounds in three months
- Principle of Finance Assignment, UCD, Singapore: National Gaming Inc. (National) operates the weekly lottery in the country
UP TO 15 % DISCOUNT